4. The GAPFRAME calculation methodology
4.3 Harmonization and conversion of source data
To measure the GAPFRAME issues and dimensions, we use publicly available indicators coming from divers sources (see Tables 1 – 4). In order to harmonize data across all 68 indicators, we create a normative scale that allows unique comparison of the current state of the world with a normative desired future state. In such an approach, the 68 indicators and the related 24 issues and 4 dimensions are presented on a scale from 0-10, with 10 being the desired ideal state and 0 being the worst case (farthest from the target).
The critical point of the GAPFRAME lays in definition of ideal and worst values that serve to convert the indicators data into a normative 0-10 Gap Frame scale. Accurate definition of ideal and worst values for each of considered indicators is of highest importance and demands an ongoing effort to check and improve these values and how they are measured.
Applied rules to define ideal and worst values for indicators
Whenever possible we respect the original scale and the target ideal / worst values associated with the individual indicators. For example, the Environmental Performance Index (EPI) indicators are already measured on the 0-100 scale, with 100 being the target value to be achieved. Similarly, the Sustainable Governance Indicators (SGI) are measured on the 1 – 10 scale, with 10 being the target value and 1 being the worst value.
For indicators without specified target values (e.g., most of The World Bank indicators or Sustainable Society Foundation indicators), we define the ideal and worst values based on currently observable min and max values as well as by projecting ourselves into an ideal state, following common sense.
Tables 1 – 4 provide detailed information on how the ideal and worst values were set for each individual indicator in our framework.
Data conversion into a 0-10 GAPFRAME scale
In the GAPFRAME approach, we convert the most recently observable values for indicators into a consistent and common set of data, as outlined in 4 steps below:
Step 1: Conversion of indicators values into a 0-10 scale based on identified ideal / worst values:
(a) If a worst value for an indicator equals to 0, an indicator value is divided by the indicator’s ideal value and multiplied by 10 (a scale factor)

(b) If an ideal value for an indicator equals to 0, an indicator value is divided by the indicator’s worst value and multiplied by 10 (a scale factor). The obtained result is subtracted from 10 (reversal method)

(c) If the ideal and worst values are different from zero, the values are normalized before starting the operations (a) or (b).

or

Table 5 lists the formulas applied to convert the 68 indicators into a 0-10 GAPFRAME normative scale, illustrating the steps (a) – (c).
Step 2: Calculation of issues by averaging the related indicators
Step 3: Calculation of dimensions by averaging the related issues
Step 4: Calculation of the GAPFRAME Score and Average of 4 Dimensions for all the countries.
| INDICATOR | FORMULA TO CONVERT INDICATOR RAW DATA TO THE 0-10 GAP FRAME SCALE | ||
| NAME | IDEAL VALUE | WORST VALUE | |
| Scale with 10 | |||
| Access to an improved drinking water | 100 | 0 | 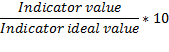 |
| Access to electricity | 100 | 0 | |
| Child survival | 100 | 0 | |
| Exposure to air pollution | 100 | 0 | |
| Fish stock | 100 | 0 | |
| Freedom of movement | 4 | 0 | |
| Organic farming | 20 | 0 | |
| Protected terrestrial habitat areas | 100 | 0 | |
| Public sector corruption | 100 | 0 | |
| Recovered & recycled solid municipal waste | 100 | 0 | |
| Renewable Energy | 100 | 0 | |
| Safe sanitation | 100 | 0 | |
| Share of voice - Freedom of assembly | 2 | 0 | |
| Soil quality | 100 | 0 | |
| Strength of legal rights | 12 | 0 | |
| Tolerance for homosexuals | 1 | 0 | |
| Tolerance for immigrants | 1 | 0 | |
| Treatment of waste water | 100 | 0 | |
| Women presence in boards | 50 | 0 | |
| Reverse and scale with 10 | |||
| Alcohol abuse | 0 | 40 | 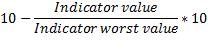 |
| Carbon consumption / inhabitant | 0 | 70 | |
| Domestic use of solid fuels | 0 | 100 | |
| Freedom of expression | 0 | 100 | |
| Gender wage gap | 0 | 40 | |
| Income distribution (GINI) | 0 | 100 | |
| Irrigated agricultural land | 0 | 35 | |
| Job security | 0 | 15 | |
| Land degradation (desertification) | 0 | 100 | |
| Minority discrimination | 0 | 10 | |
| Natural resources depletion | 0 | 15 | |
| Obesity rate | 0 | 40 | |
| Phosphate consumption / cultivated land | 0 | 10 | |
| Poverty among population | 0 | 75 | |
| Safety on the road | 0 | 40 | |
| Slave labour | 0 | 1.5 | |
| Sufficient food | 0 | 40 | |
| Terrorism | 0 | 10 | |
| Unemployment rate | 0 | 30 | |
| Work-Life Balance | 0 | 30 | |
| Youth unemployment | 0 | 60 | |
| Normalize and scale with 10 | |||
| Adult literacy rate | 100 | 30 | 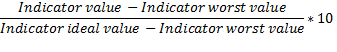 |
| Availability of latest technologies | 7 | 1 | |
| Companies with a sustainability report | 100 | 25 | |
| Ease of access to loans | 7 | 1 | |
| Effectiveness of anti-monopoly policy | 7 | 1 | |
| Ethical behaviour of firms | 7 | 1 | |
| Female representation in parliament | 50 | 10 | |
| Good governance | 15 | -15 | |
| Internet users | 100 | 1 | |
| Judicial independence | 7 | 1 | |
| Legal Certainty | 10 | 1 | |
| Policy Knowledge | 10 | 1 | |
| Primary education, enrolment rate, net% | 100 | 60 | |
| Quality of educational system | 7 | 1 | |
| Quality of overall infrastructure | 7 | 1 | |
| Quality of support network | 100 | 70 | |
| Renewable Water Resources | 10 | 1 | |
| Soundness of banks | 7 | 1 | |
| Water quality | 100 | 60 | |
| Youth in educational training | 100 | 50 | |
| Normalize, reverse and scale with 10 | |||
| Budget balance | 1 | -15 | 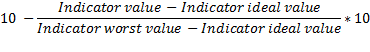 |
| Carbon quotient | 0.9 | 5 | |
| Energy intensity | 2 | 20 | |
| Energy Savings | 0.4 | -0.4 | |
| Extinction rate of animals | 2 | 100 | |
| Government debt | 2.5 | 150 | |
| Healthy business support | 2 | 15 | |
| No data convertion | |||
| Life satisfaction | 10 | 0 | - |
Table 5. Formulas applied to convert the 68 indicators values into a 0-10 GAPFRAME scale.