27-11-2017, BSL Newsletter – The GAPFRAME is a translation of the SDGs into national priorities. Its 24 issues integrate the SDGs and include a few more elements where relevant. Therefore, we can expect a good overlap of the GAPFRAME and the SDSN datasets. Where the GAPFRAME differs from the SDG Index is that it compares countries to an ideal state of the world rather than against each other as is done by other frameworks including the SDSN-based SDG Index. How does this difference reflect when comparing the country performance of the GAPFRAME versus the SDSN SDG Index?
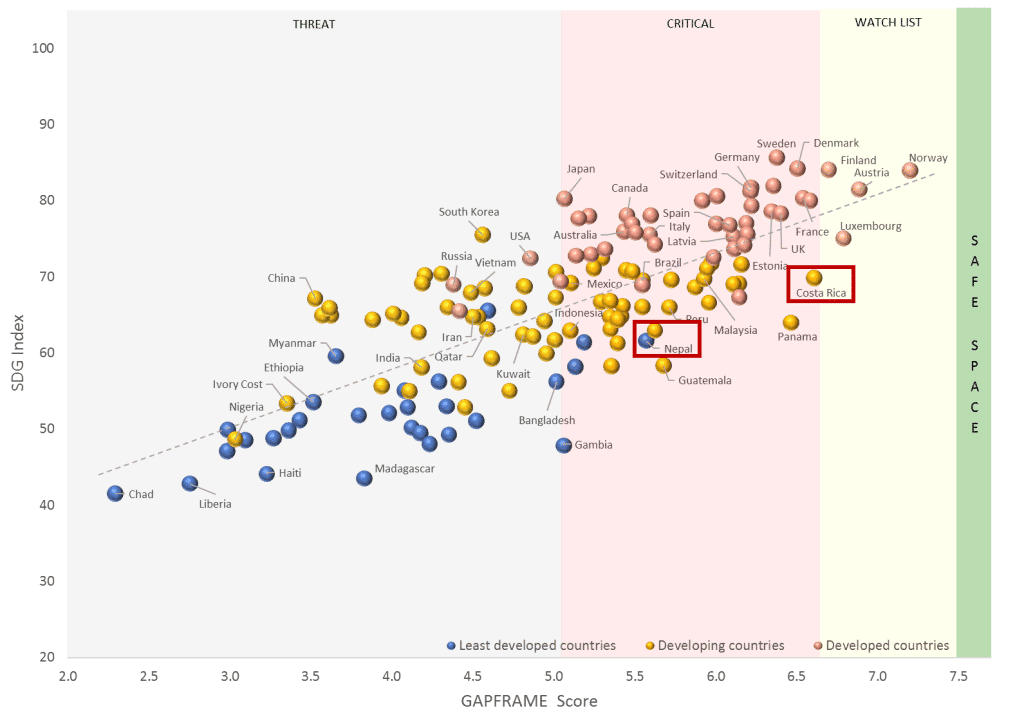
Comparing the country rankings of the GAPFRAME and the SDSN report, there is a good correlation of the results (see Figure 1). The top ranking countries in the SDG Index also appear in the GAPFRAME top rankings. In both indexes, developed countries (red) perform better than “developing” (yellow) or “least developed” (blue) countries. In the GAPFRAME, developed countries are closer to achieving the safe space and in the SDSN SDG Index; they are closer to achieving the Agenda 2030.

Comparably stronger GAPFRAME performers show capacity to balance priorities
Nepal and Costa Rica stand out with a significantly better performance in the GAPFRAME (ranked 46 and 5 respectively) than in the SDG Index (105 and 53). Both countries rank top in their GAPFRAME geopolitical regions. Nepal (least developed) performs equally well as Brazil (developing) or Italy (developed) and even better than USA, Russia or Japan. Costa Rica (developing) appears 5th in the GAPFRAME ranking, overtaking most of the developed countries. So, what do these countries have in common, and what drives them closer to safe space? In brief: what are they doing right?
While neither country has all its issues under control (no country does!), both have well-balanced results across the four sustainability dimensions (governance, economy, planet, society). They have been able to reach their current state of development, without sacrificing the environment or societal concerns, unlike most other developed countries.
| Dimension | Nepal | Costa Rica |
| Planet | 5.8 | 6.6 |
| Society | 5.8 | 7.3 |
| Economy | 5.8 | 7.2 |
| Governance | 5.6 | 6.8 |
Nepal has all four dimensions in CRITICAL (no dimension in the THREAT) and Costa Rica has three of dimensions in the WATCHLIST, and one very close to it.
Comparatively weaker GAPFRAME performers have an issue with “Strong Sustainability”
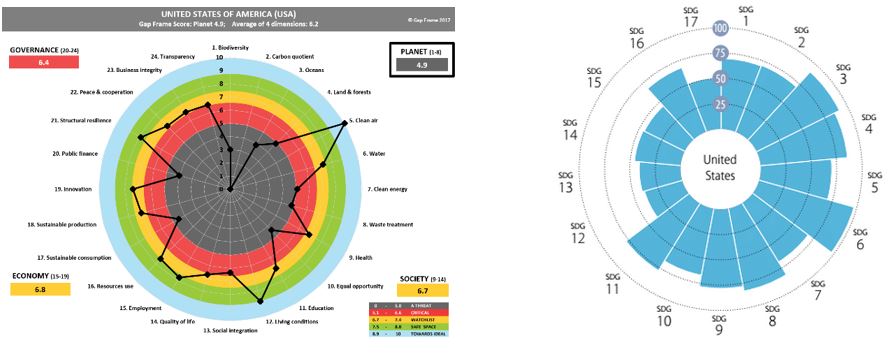
Not many countries are able to show such balanced priorities across all four sustainability dimensions. Take for example the USA, ranking 42nd on the SDG index. The country comes only 89th in the GAPFRAME. Although USA have the Economy and Society dimensions in WATCHLIST, its Planet dimension is in the threat. This indicates that the country economic and social development have come at the expense of environment. The SDG index reflects a similar state (see the graph on the right). While the USA also performs poorly across the environment related SDGs (#12 responsible consumption and production, #13 climate action #14 life below water and #15 life on land), the country’s SDSN SDG Index rank is impressive. Too much so?

The GAPFRAME compares the sustainability dimensions of a country and measures it based on the score of its weakest dimension. It enables countries to prioritizes and focus on the dimension that needs work most urgently. The difference in USA’s ranking in the GAPFRAME (89) and the SDG index (42) demonstrates how weak sustainability can often lead to a false sense of ‘doing all right’. In the GAPFRAME, the poor performance of USA in the Planet dimension can not be compensated by better results in Economy and Society dimensions. The fact that USA performs very well across SDG 3 (good health and well-being); SDG 4 (quality education); SDG 6 (clean water and sanitation) and SDG 8 (decent work and economic growth), places it in 42 position in the SDG Index ranking. How relevant is such a position for a developed country that has very different priorities to resolve than the general Global Goals of the SDGs. The GAPFRAME provides further information for every country across all development stages and stresses the importance of the “Strong Sustainability” concept: that one dimension cannot be sacrificed for the development of another. An issue that every single developed country faces!
About the SDG index
The SDG Index was developed by the Sustainable Development Solutions Network (SDSN) & the Bertelsmann Stiftung and it allows to assess where each country stands with regards to achieving the Sustainable Development Goals 2030 (see the 2017 SDG Index Launch here; the overview here).
About the GAPFRAME
The GAPFRAME is an easy-to-use data visualization tool designed to give practical support to everyone working towards a sustainable and safe future.
It is the culmination of 18 months’ work by a group of Sustainability Thought Leaders, driven by the desire to make it easier to deliver on the Sustainable Development Goals. The GAPFRAME translates the 17 Global Goals into relevant and measurable issues for each nation and presents them in a visual multi-dimensional world map.


